What is Architecture?

Background:

Architecture and Engineering are two terms often used to describe IT roles. In 2002, I was fortunate enough to work on a large Enterprise project using Spewak’s methodology. Prior to that project, I worked on many financial data related projects and intuitively was able to properly organize the data for maximum flexibility. My success with data was well enough known that other areas reached out to understand my approach. The Enterprise project in 2002 provided a methodology that aligned with what I had been doing intuitively, Since then, I’ve adapted the methodology for many different projects. It really didn’t matter the type of project (e.g. Configuration Management, Customer Enrollment, Eligibility) the methodology proved to be a pragmatic way to create an Architecture for the project. Projects always had two key components, business process and data required to support the business process.

From the forward to Spewak’s book: Enterprise Architecture Planning: Developing a Blueprint for Data, Applications And Technology :

“As I was reading this book for the first time, I was occasionally skeptical about a particular methodological point. However, in every instance, before I had read to the end of the chapter, I was convinced that the innovative and pragmatic approach to accomplish the purpose was sound.”  – John A. Zachman

My website, Above The Line It is about looking at IT solutions from a business perspective. The focus is to create a logical architecture along with clearly defining business data. Hopefully, over a series of posts I’ll be able to outline a methodology for a logical architecture that aligns with current applications of technology. The first step is to define the Architecture or more specifically a Logical Architecture for IT.

Architecture Definitions:

Architecture is described by Encyclopedia Britannica as:

the art and technique of designing and building, as distinguished from the skills associated with construction. The practice of architecture is employed to fulfill both practical and expressive requirements, and thus it serves both utilitarian and aesthetic ends

For the IT Architecture role, Gartner Architecture Glossary provides their definition of Architecture as:

  1. In reference to computers, software or networks, the overall design of a computing system and the logical and physical interrelationships between its components. The architecture specifies the hardware, software, access methods and protocols used throughout the system.
  2. A framework and set of guidelines to build new systems. IT architecture is a series of principles, guidelines or rules used by an enterprise to direct the process of acquiring, building, modifying and interfacing IT resources throughout the enterprise. These resources can include equipment, software, communications, development methodologies, modeling tools and organizational structures.

Britannica clearly separates Architecture from construction and implies Architecture is a combination of Art (expressive) and Science (utilitarian). Gartner mentions ‘logical’ a single time with the rest of the definition focusing on the orchestration of the technical aspects of the architecture (i.e. construction). A more robust Architecture definition requires aspects of both the logical aspects of Britannica’s definition and the technical aspects referenced by Gartner. The Logical Architecture does not require any specific technology in the initial steps of defining the architecture.

Technical considerations apply to a Logical Architecture similarly to how engineering guidelines apply to an Architecture designing a house. The Architect is aware of engineering guidelines to build. Those only serve to guide the architecture. The decision to use a laminated bean or a steel beam for support has little impact on the overall architecture of the house.

Logical Architecture Methodology:

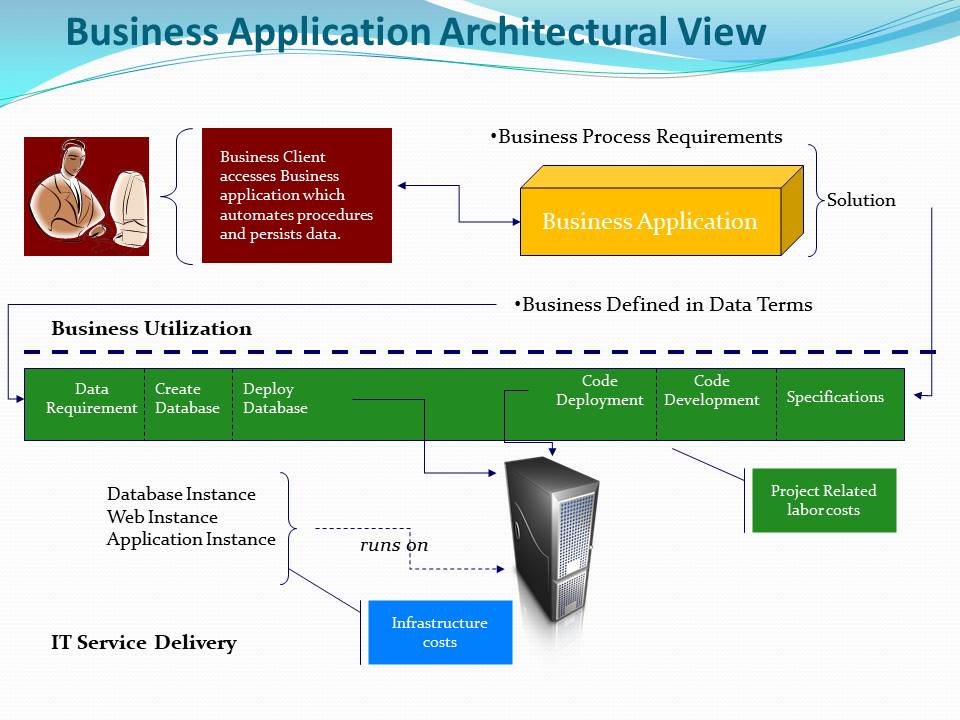
The four pillars of creating a robust Architecture are Business Architecture, Data Architecture, Solution Architecture and Technical Architecture. The below briefly defines each pillar and how they relate to your final Solution Architecture used to construct a Business Application.

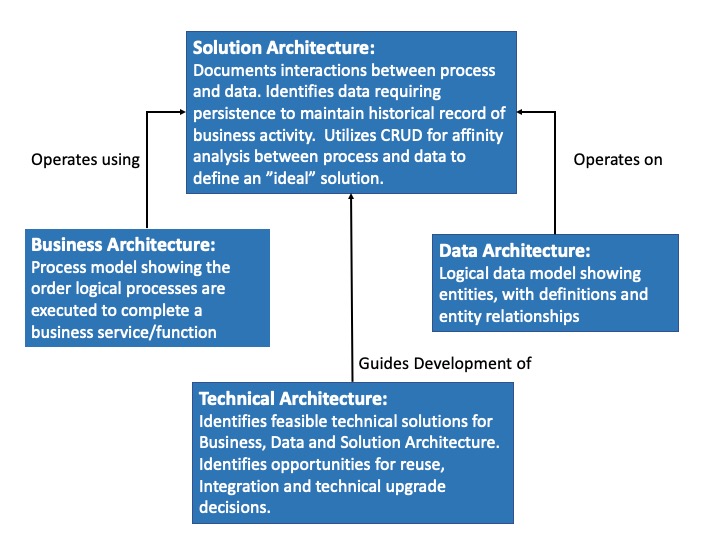
Logical Architecture starts with the business. The methodology consists of business process and data modeling. As you build out the business process model, it’s important to understand the data (data entities) that each business process uses. This will help organize business processes and data into a recommended Solution Architecture. Technical Architecture guidelines are used to construct the Business Application from the logical Solution Architecture.

Where to begin?

Start by putting the business first. On occasion you hear “IT Drives the Business”. I prefer to take the perspective of “IT Accelerates the Business”. The former puts IT first while implying newer technology improves business outcomes. The latter embraces the business to improve the current state and accelerate business critical decisions, improve response time to the market, or flexibility to deliver new services to the market.

Another aspect is you do not need to start by exhaustively deconstructing all the existing business applications currently used to run the business. This is expensive and time consuming process that is not repeatable. Rather take the approach of documenting business in terms of the business processes and key data concepts developing a deep understanding of the business. The entails documenting the logic and semantics of the business. Taking this approach defines solutions within the business context. At this point, you can inventory you current business applications and organize them by your IT Logical Architecture.

You can begin to lay out your architecture project by first taking into account that businesses have a natural “left to right” flow of processes and critical data components. Take the example of starting a new business. Most likely, it starts with an idea for a product or service (i.e. Product Development). The next step is to identify a target customer (i.e. Market Research) and hopefully you’ve been able to sell the product (i.e. Sales). This quickly defines business processes requiring further analysis. It’s also apparent how data relates to each process. This helps define foundational data for your business: Product, Customer, Sold Product which can be modeled.

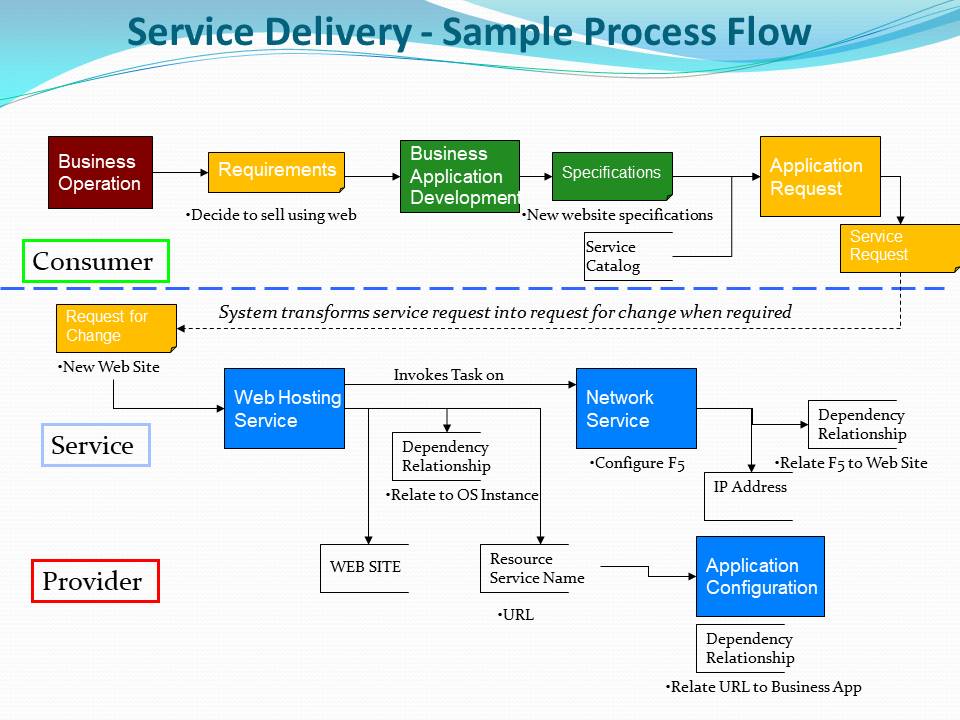
Enterprise Architecture can conjure up visions of expensive, long running projects without achieving the promised benefit to the business. In some cases, Enterprise Architecture is described a big E and little e. As with anything, the larger the project the more risk for failure. Instead of Big E and little e, start thinking in terms of context. Logically looking at the sample business below shows three “contexts” to use for continued analysis. The contexts created are Product Development, Market Research and Sales. This allows project planning to define the effort in manageable pieces. Below is a sample notation used to visually depict the new business outlined. The shaded boxes are the high level business process, the lines indicate data flow and the open boxes depict data entities. The data entities depicted on the process model relate back to enterprise logical data model.

Immediately, three focus areas are identified along with the foundational data required to run the business. Market Research is taking the customer characteristics you plan to target and applying it to the universe of customers. The output (i.e. data) is Customer. Product development is defining the products planned for those customers. Sales would contact Customers identified from Market Research and hopefully sell the Products. The output again is data, Customer Product.

A close relationship between process and the data created by the process provides the context to develop your Solution Architecture. It’s at this point you can start to apply your technology best practices to create a target solution architecture. Understanding the process that creates each type of data begins to layout your data domains. For example, Market Research creates the Customer data. A best practice is to make this your company’s source of truth for Customer data.

Thinking ahead to a Market Research implementation, Market Research needs data services for all the actions required to maintain a Customer. This includes managing unique Customers along with data about Customers. The initial view is that all customers are created and maintained by Market Research. Reality is this is one source of Customer creation. Over time Customers can be identified via referrals, customer initiated or through sales contacts. Each one of these have the same data management needs to create, maintain and update Customer data that Market Research has. The scope of the solution should consider having Market Research develop a robust set of customer data services to share across the enterprise. These data services can then be presented via a variety of mechanisms for input.

Recommendation:

Before embarking on a effort to upgrade existing systems or purchase a vendor product, take the time to create a Logical Architecture of your business. A logical architecture is independent of any current implementations and can be used to evaluate how well current implementations meet business requirements.

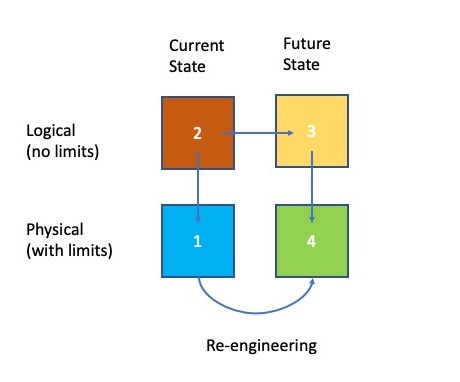
A logical view creates a business context for evaluating current implementations and vendor solutions. Opportunities for data sharing and consolidation of applications is more obvious. Starting Above the Line IT, avoids the trap of re-engineering existing implementations with an expectation of getting better results for the business.

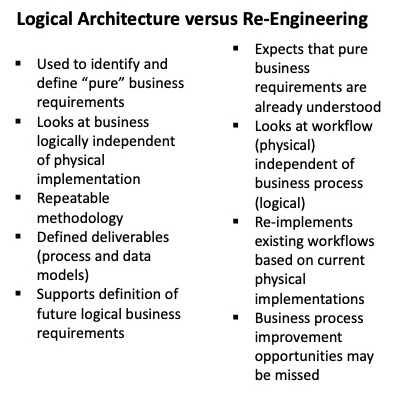
See my post discussing the difference between Architecture and Re-Engineering.

Posted in Data | Leave a comment

Architecture versus Re-Engineering

Modernization of business applications can take many forms. One approach is doing a deep dive into the current implementations to document the current state. Another approach is to create a technical architecture of the current implementations. In the first approach, the analysis attempts to identify the business requirements as currently implemented. Followed by a strategy to migrate to some future state (i.e. migrate from a monolith to a more modular solution). The second approach identifies current infrastructure and software used. This may result in a strategy to migrate to a new platform (i.e. from “on prem” to the “cloud”). Both approaches often end up re-engineering current implementations without gaining improvements for the business.

A third approach is to create a logical architecture of the business. This provides the opportunity for the business to re-think their current processes. Creating a logical architecture frees the business from any limitations embedded in current implementations. The logical architecture provides a vision for a future state without limitations. This avoids the trap of re-implementing existing, inefficient business processes. The diagram below depicts the relationships between logical and physical environments for current and future state architectures.

The diagram shows the current logical architecture state as it sits over the existing physical implementation. The line from 2 -> 3 shows taking the current logical business architecture state and moving to a future logical business architecture. The future state logical architecture is used to create the future state physical implementation. The overall success of any future state implementation is dependent on how closely the logical architecture aligns with the physical implementation (i.e. alignment of business requirement to implementation).

Unfortunately, it is not unusual for there to be gap between what the business wants logically and the physical implementation. This gap in the implementation results in additional steps or workarounds for the business. This is not uncommon when purchasing a vendor product to perform business functions. Vendor products are based on a logical architecture on how to best automate a process. The vendor product’s “Industry best process automation” is their value proposition.

The depiction below shows a misalignment of the logical architecture with the physical implementation. This happens when the business strategy is mis-aligned with the IT development strategy. The area in between 4A and 4B is filled by manual business processes to bridge the gap between two implementations. An example of a workaround is to require duplicate manual data entry to fill the gap.

Assuming there is not a current logical architecture of the business such as business process models, enterprise data models and the relationship of data to processes. It’s necessary to analyze the current implementation to establish the logical business perspective. This is followed by working with the business to modify the derived logical architecture into some future state implementation. This approach requires a lot of expensive, upfront analysis.

Logically, you can avoid the assessment of your current implementation and start directly with the business (box 3) to define the business logical architecture for the future state. This avoids the trap of re-implementing business processes that existed solely because “that is how the system works”. Your options are limitless giving you the freedom to re-think the most efficient way to run the business. This creates a context to organize and analyze current system implementations.

A Logical IT Architecture defines the foundation your business requires to function using process to data. From a strategy perspective, the architecture allows proper prioritization of efforts and highlights dependencies. For example, a business can not sell a product until you first have a product and find a customer. This logical approach provides a broad view of your business by removing all the detail complexities inherit when analyzing current implementations.

Below lists the characteristics comparing a Logical Architecture with a Re-Engineeirng effort:

Recommendation:

Start with the business, logically layout the business processes and data. Defining the business by creating a logical architecture uses a common language (logic) understood by both business and IT professionals. This becomes great medium for the exchange of ideas while defining a future state strategy. Dependencies and foundational elements of the business become clear. This logical architecture establishes context or domains for organizing current implementations.

Use can the logical architecture to organize the deep dive into existing implementations. Use the context provided by the logical architecture to organize your teams by their domain knowledge for any necessary analysis of current state. It’s likely a lot of time and effort (i.e. money) is saved taking this approach.

At this point, you’re ready to begin to layout the strategy you need to build your future state.

Posted in Data | Leave a comment

Understanding a Business Application

A Business Application is the solution developed by an IT area to improve and accelerate the pace at which a business can perform it’s tasks.  Developing a business application covers many disciplines and incurs costs from a variety of services.  Cloud based solutions have complicated  managing the cost of an application because not only are there multiple services, there are multiple providers.

The image below depicts where these investments are made when developing a Business Application.

Another way to organize your IT costs is to track it in terms of the services engaged to build, deploy and run the application.  The below example depicts the separation of business and IT around services.


There are three main entities for tracking costs:  Consumer, Service and Provider.   The Consumer is the entity getting benefit from the service.  The Service aspect is some measurable and manageable aspect of service units (e.g. OS Instance, Storage GB or Labor Hours).  Provider is the entity providing the service.  Defining who the providers are and tangible services is the first step in understanding the cost of Business Application.

This same structure would work when tracking cloud computing costs.  Basically, align the services you are getting from your cloud provider with the services.   For example, a Web Hosting cloud solution will include Network, OS, and Storage services for your website.

Posted in Cost Management | Leave a comment

Master Data Management – Data Velocity

Worldwide master data management (MDM) software revenue will reach $1.9 billion in 2012, a 21 percent increase from 2011, according to Gartner, Inc.  The market is forecast to reach $3.2 billion by 2015.  Research by Dell ‘Oro group is predicting that the average storage requirements for fortune 1000 companies to grow from an average of 1.2 petabytes in 2011 to 9 petabytes in 2015.

Will the increased spending on MDM software be enough to manage the increase in data?   The good news is that it probably will.  One of the key aspects of MDM is to clearly define the data entities in clear unambiquous terms.  In addition, MDM also encourages a focus on having business processes to manage the data entities for accuracy.

This sounds good but you run the risk of investing a lot of money and not getting the return you expect unless clear objectives for the MDM project are established.   MDM was first introduced to address data quality issues and manage a single view of a customer or product. A successful MDM project clearly defines the business process, engages the appropriate people as data stewards and implements a tool set for managing the data (i.e.  People, process and technology).  In addition, a clear scope and definition of the business entities to be managed.   Without a clear definition of scope and purpose, the project will not deliver the desired business value.

Gaining agreement on scope and purpose is critical for success.   The purpose of the project includes the key performance indicators, KPI, used to  to measure the project success.   One simple KPI might be ‘percent reduction of returned mail.’  The candidate entity would be ADDRESS and MDM would be used to standardize addresses to facilitate identifying bad addresses, correcting addresses and managing  address changes.   Going through the effort of getting clean addresses is valuable to the extent this quality data can be leveraged across all systems.

Interestingly, a number of techniques used to load data warehouses can be managed by the MDM solution.   The first step when loading a data warehouse involves standardizing the data with ‘cross walk’ tables for codes (e.g. product code, risk codes).  A typical data warehouse goes through the process a cleaning the data to provide a single view of a company’s data.   The challenge is the timeliness of the data.

A data warehouse is going to lag behind and have data slightly older than what is in the online transactional systems.   The lag is caused in part because of the time it takes to transform data into the structure the data warehouse expects.  Employing an MDM can shorten the time it takes to make data available by managing a common set of IDs across systems.  This MDM ID can be used to load data of common entities into a single data store more easily.

Address, Customer, Vendor and Product are a few good candidate entities for an MDM project.  Address, as mentioned above, has a very tangible KPI, postage costs.   The value of managing Customer, Vendor and Product with an MDM project may be a little more difficult to measure.  Better management of these data elements would definitely help a company manage customer demand, understand costs and provide customer service.

A broadcast, Change Artists, caught my attention a number of years ago and I saved the Change Artist Transcript from the web.  Nestlé’s CEO Peter Brabeck and Deputy Executive VP Chris Johnson were interview.  I think the interview was around 2006.   The embarked on a worldwide project they call GLOBE with the objective of improving their data.  MDM requires a commitment of the right people, a solid process and systems that support the people and process aspects of the final solution.

The interview provides some great insight into how Nestlé improved the quality of their data.  Here are a couple of interesting comments from the project.

Well, the GLOBE Project, overall, is really not an IS/IT project. I think if it was I don’t think he would have chosen me to run it, because certainly that’s not my background or my expertise. It’s really a business initiative. – GLOBE stands for Global Business Excellence.

Steve Johnson

It’s clear that the business has set clear expectations for the project.

The first one was to implement harmonized best practices. So in other words, to take the best ways in doing business around the Nestlé world and share them. Very basic. The second one, which is not very sexy, but very important, is to standardize our data and our approach to data management; to treat data as a corporate asset. And the third one is to then support this and enforce it through standardized systems and technology. So it’s harmonized best practices, standardized data center, and systems.

Steve Johnson

According to the interview, these objectives were know across the entire company worldwide!   About 80 percent of the company was impacted.  The interview indicates the project spans 100,000 users across about 1200 locations of  factories, distribution centers, and sales offices.

They highlighted very tangible results from their GLOBE program.

Because quite honestly, we thought before the GLOBE program that we had 6 million customers, vendors, and materials. At least that’s what was in our systems. After going through the GLOBE exercise of cleansing, we realized that, well, about two-thirds of that was duplicate, obsolete, or just plain wrong.

Steve Johnson

Here is a great example of successfully improving data quality and company operations by implementing a project focused on data as an asset.  As evidenced by Nestlé, success is dependent on engaging the right people and having clear objectives.

Conclusion:

The original question was

Will the increased spending on MDM software be enough to manage the increase in data?

The original answer was ‘probably will’.  But seems to me, technology alone will not solve the problem.   Without engaging the business and having the right objectives, an MDM project is just another expensive IT endeavor.   MDM run from a business perspective to ensure delivery of business value is critical so the investment in the MDM projects will be worth IT.

In addition, the problem is not data volume but instead it is data velocity – making data available more quickly to the the business.  MDM speeds up the process of managing quality data and provides context for loading large volumes of data.  Once a quality MDM solution is in place, the increase in data volume can be handled with a scalable MDM solution.

Posted in Data | Leave a comment

Importance of Relevant Data

Most software solutions fall short of customer expectations due to one common problem:

Not properly capturing the relevant business data. 

Failure to capture the relevant data makes it difficult,  if not impossible for the business to measure results.  In my article, What Makes a Business Application, I explain how application design requires a thorough understanding of the affinity between process and data.  Keep in mind that the data captured at the end of the process is all that remains from the business process.

Automation involves the instantiation of a business process into a software solution.    The process or execution of the business process captures, transforms, and stores data about the business process.   Issues generally arise when the software solution only captures data about the final result.   The process loses the data used to arrive at the final result creating a data gap or lose of relevant data.

Often the ‘relevant data’ is not understood by the system developers and data is captured for system processing reasons without necessarily considering any business needs for capturing data.   This is where understanding the business helps the developer determine what data is transient to the application and what data should be persisted.  Suppose you are asked to develop an online loan application system.  What data is relevant and what steps do you take to ensure you capture the data relevant to the consumer and lending institution.

To demonstrate this, take the example of applying for a loan.  You log in to an online loan application.  You are asked to provide data about yourself including income, loan amount and possibly what you plan to do with the loan proceeds.  The rules engine uses all the data you entered to determine whether or not you are eligible for the loan.  Once the rules engine completes it only captures the data needed to identify you, the application number, date of the application and the loan decision.  No data explaining how the loan decision was made is captured.

You are notified that you are denied the loan.  You call the lending institution to question the decision.  The representative looks up your application and confirms that you have been denied.  You ask questions about why you were denied and the representative can not answer anything but repeat that you were denied for the loan and what date you applied.

The sparse data stored by the web loan application leaves both the customer and the business representative frustrated.  If the loan application captured additional data about the loan process such as income, loan amount or reason for the loan decision.  This data would help the representative help the customer consider other options.  Suggesting a lower loan amount might be enough to get the loan approved.  The additional data about the process helps both the business and the customer.

Failure to capture the ‘relevant data’ used by a business process happens much more often than it should.  This gap in data results in lost business and often requires manual processes or expensive rework to address the data gap.  When building an application, put yourself in the position of both the business and the customer.  Ask yourself what would you want to know about the business process you just automated.

Capturing the ‘relevant data’ about the business is one of the key success criteria for any application development effort.  Are you saving enough of the data input to explain the business result?  Can you easily provide the details to support the data you are reporting?  Can you re-construct the process from the initial data capture to the result reported with the details you store?   For many business process automations, the only output is data so make sure it is complete and represents the complete business process.

Posted in Data, Solution Architecture | Leave a comment

The Purple Trap

Data modeling is a methodology used to logically represent the data you store about your business and is an important early step in any Data Warehouse project. The quality and grain of the data identified in the data model is a key step to building a Data Warehouse that can provide insight into your company’s customers, products and business operations.  Determining the correct level of detail or grain of data about your business is a difficult but critical step to success.

As with any IT project, limits of time and resources dictate the quality of your project. In the case of a Data Warehouse project, cost and available resources impact the level of detail data you ultimately capture in the Data Warehouse.  Determining the level of detail is part art and part science. Making the best decision starts with how well you understand your business.  Choosing the correct level of detail will directly impact the quality of analysis and business value the Data Warehouse project provides your company.  But remember, once you have chosen the level of detail for the Data Warehouse it is very expensive and difficult to change.  Essentially your early decisions can trap you with less than optimal results.

Deciding on the appropriate level of detail data to capture is probably one of the most important decisions made in data modeling when trying to provide flexible reporting to the business.  Do you capture the red and blue data separately or capture the myriad shades of purple knowing you can estimate the amount of red in purple.  The answer really depends on the business perspective. If I have a car dealership, I may only be interested in the shades of purple I can offer. On the other hand, if I’m a paint store I may keep the red and blue separate along with the business rules needed to get the right combination of red and blue to create the shade of purple needed.

Using purple as an example, having detail about the shades of purple is perfectly ok if you’re a car dealership but what about a paint store?

Say two paint stores open in your town, Tom’s Purple Paints understands the current market and that only one shade of purple is popular and they get a great deal on purple paint by signing a long term contract to buy that one shade. The Kaleidoscope Paint store opens with the same understanding of the market that the current demand is for one shade of purple. The  Kaleidoscope Paint store makes the strategic decision to sign long term deals to buy red and blue paint because they realize that with minimal effort the popular shade of purple can be mixed from the red and blue therefore Kaleidoscope Paint has the flexibility to react to market changes.

Choosing the grain of data to store in a database is not unlike the decisions these two paint stores made.  They each made strategic decisions about the shade of paint they needed for their businesses. It should be obvious that the Kaleidoscope Paint store is positioned to respond to market changes much faster than Tom’s Purple Paints.  In addition to being able to react to market changes, Kaleidoscope Paints can drive market changes by experimenting with different shades of purple and analyzing customer’s reactions to expand their business.

Data is no different.  It’s just much harder to visualize what you lose when you choose the wrong grain of data to store. Remember that Databases and Data Warehouse projects are long term investments!  You don’t get many opportunities to determine the level of detail to capture.  Make every opportunity to capture the right detail of data.  Choosing the right level of detail in your data is critical to your project’s success and possibly your business’s success. You don’t want to be like Tom’s Purple Paints!

Considerations for choosing the best grain of data for your business:

  1. Understand the essence of your business and business strategy
  2. Avoid over reliance on industry data standardization patterns
  3. Remember patterns are generic so use them for your generic data (e.g. Address)
  4. Evaluate industry standard patterns in the context of your business
  5. Find the data that is specific for your business’ success and own it
  6. Define your data thoroughly so it’s clear what the data means for your business
  7. Clearly indicate in your definitions what grain of data you’re storing
  8. Don’t limit your thinking to the current level of data captured by your business
  9. Listen for what data the business uses for making decisions
  10. Challenge the current understanding of data about your business

Deciding not to track certain facts about your business or generalize too much will limit the value of your Data Warehouse.  Data detail is just like color, you need to understand the grain. The number of colors you can store is limited but storing the base colors creates limitless flexibility because with new formulas you can add new colors with ease. That’s the flexibility a well designed Data Warehouse can provide your business!

illustration by Paul Kulikowski
Posted in Data, Solution Architecture | Leave a comment

SOA and IT Services

It’s not unusual to find confusion between Service Oriented Architecture, SOA, and IT Services.  SOA is a methodology used to take advantage of re-use and ease of maintenance.   IT Services on the other hand is a broad term used to describe a deliverable (e.g. database, a website) from an IT Functional Area.

SOA is a design protocol that makes a frequently used business function available to many disparate systems.  SOA functions are ‘made available’ through protocols or APIs and implement a self-contained set of business functionality.  SOA modules don’t call other programs but rather work on the data it gets and provides a result.  It’s an efficient way to design and build an application.  A set of loosely coupled functions can be cobbled together to build an application.

Re-use and ease of maintenance are achieved when the same function (i.e. program code)  is used to build multiple applications.  Managing changes to functions implemented using SOA is easier because when you change the function in one place (i.e. program code), all consumers of that function are the updated.  Data is typically moved between services via well defined APIs.

SOA is a development and design methodology for designing solutions.  This is the level of programming that implements business rules and requirements.  IT Services on the other hand, provide the environment used by the solutions built with SOA.   An IT Service is a tangible deliverable from IT.  SOA provides the components necessary for building and delivering Business Solutions.


Posted in Solution Architecture | Leave a comment

IT Service Catalog

Cloud Computing has added a new degree of complexity to managing IT by increasing the number of IT providers. A robust IT Service Catalog sets the stage for effective IT management in the new world of Cloud Computing.   The key is to manage both the service offering and the service provider.

Typically, a service catalog offers services in the context of IT to business and IT to IT.   Cloud Computing has commoditized a number of IT services that makes it reasonable to make some of the Cloud Computing services available though the service catalog.  Especially with some IT to IT service, for example in a development environment.

A couple of examples come to mind, web hosting and database development.  Web hosting sites such as Dreamhost.com provide a low cost environment for doing web development.  By the same token, Azure by Microsoft provides a complete development environment for .net and SQL Server.   These services are well defined and the cost of the services are clear as well.

Utilizing services in the Cloud for development can provide an IT department with tremendous flexibility.  IT can then focus on managing the production environment without having to support small development environments.  Internally, tracking the service provider within the service catalog along with cost allows the service consumer to make an informed decision based on price and service.

Security concerns have been the primary reason why companies have been reluctant to adopt Cloud Computing services. Adopting Cloud Computing for a development environment is one way to minimize the security risk while kicking the tires and getting experience with Cloud Computing.


Posted in Cloud Computing, Cost Management, IT Services | Leave a comment

Configuration Names

Configuration Management is very important to running a large company’s IT organization.  Configuration management provides you with all the data needed to understand the impact a change to the IT systems will have.  The critical question to answer is what information do you store in your Configuration Management database. One approach is to capture the names used by IT when they refer to the services they provide.  Categorizing the names into three distinct types: Resource Service Name, Network Name and Configuration Item Name will help you organize the lexicon of IT.

Resource Service Name

Most companies have a Service Catalog for ordering IT services.  When you order an IT service they provide you with a name which references the service that you ordered.  A database name or a website URL are two examples of Resource Service Names.  From an  IT perspective these ‘logical’ names  need to be recorded in the Configuration Management Database. In addition to storing the names, IT would need to record relationships of the Resource Service Names to the underlying infrastructure providing the service.

Network Name

Most Resource Service Names are tied to a Network Name within your data network or your intranet. For example, a URL would need to be recognized by your network in order for your web browser to connect to the appropriate services to deliver your web content.  Maintaining the relationship between the Resource Service Name and Network Name in your Configuration Management Database is one meassure of the completeness of your Configuration Management Database.  If the Resource Name is not defined to the network you are not going to find the resource you need.  Comparing the network names related to either a resource or configuration item versus the total number of network names is a tangible measure of completeness.

Configuration Item Name

Configuration Item Name is the name that is assigned to the configuration items in the configuration process. Again, this is logical name that is assigned during the configuration management process and may or may not be defined as a Network Name.  At a minimum, this name needs to be related to a Resource Service Name or Configuration Item Name.

Using these three categories provides a framework for defining the context for your Configuration Management Process to build your Configuration Management Database. Because many of these names are logical and defined by individuals, recording the names has to be part of your configuration management process.

Choosing this level of data for a framework allows you to quickly understand a very large IT organization in a short period of time.   This gives you a high level view of the IT landscape. Now you have the context for going to the next level of configuration detail knowing that below each one of these ‘names’ is another level of detail of configuration information that needs to be captured.

Posted in IT Services | Leave a comment

What makes a Business Application

Business Process Modeling, BPM, and Data Modeling, DM, are two disciplines key to designing a robust Business Application.    BPM outlines process, procedures and business logic used to run the business. DM organizes the data stored to manage and measure business performance.  Unfortunately, these two activities are loosely connected during requirements analysis.

Logically, a Business Application is a collection of both process and data that have a close affinity to each other.   The affinity between process and data is determined by what actions the process takes on the data.  For example, data created by a process has a close affinity while data that is read only does not.


A modified version of IDEF0 is an excellent way to understand the relationship between process and data.   IDEF0 notation shows that in addition to process logic, a process has inputs, outputs, controls and mechanims.    In the world of data processing, the inputs, controls, and outputs represent all the data needed for a process.  The mechanism represents the system or technology used to perform the process. 

Inputs to a process can be data from an upstream system or maybe an application that is keyed into a business application to open an account.  The controls are read only data such as rules or reference data required to govern a process.  Output is the data that is captured about the business process.  What key is that the output is data created by the process. Knowing where data is created is key to establishing data quality for you business.

Using this simply notation will help you tie your data to the key processes.  It will ensure that all the data needed is available to the business process.  In addition, understanding the affinity between the process and data will help you properly define and manage the scope of the buiness application you’re designing.


Posted in Data, Solution Architecture, Uncategorized | Leave a comment